
My Sakarya University Graduation Thesis
Hello! In this post, I’ll talk about my graduation thesis—a project I thoroughly enjoyed working on at university.
First, let me introduce our thesis topic and team members. Our topic was to develop “ a Decision Mechanism Capable of Distinguishing Between Asthma and Tuberculosis Using Fuzzy Logic ”. A four-person team was formed for this project, including me. After a year of intense work, my teammates Sena KASIM, Özgün KARADUMAN, and Yunus Emre KOÇ and I successfully completed an application that works with a 93.62% success rate.
We also extend our endless thanks to our advisors, Prof. Dr. Nejat YUMUŞAK and Asst. Prof. Mustafa AKPINAR, who never withheld their interest or support throughout the planning, research, execution, and writing of our thesis; whose deep knowledge and experience we benefited from greatly; and who guided and informed us while shaping our work in the light of scientific foundations—for the valuable knowledge they shared with us.
So what is Fuzzy Logic?
Unlike the logic we know that deals only with 1s and 0s, Fuzzy Logic can also cover the values between 1 and 0 (infinitely many values) and helps computers think more like people. In short, instead of reporting definitive outcomes such as “ Yes ” or “ No ”, fuzzy logic can also accommodate uncertainty—situations like “ Maybe ”. The purpose behind fuzzy logic is to enable computers to think and reason in a way that is as close as possible to humans.
As with any approach, fuzzy logic has advantages and disadvantages. I’ve listed some of them for you in the short lists below.
Advantages of Fuzzy Theory
- It is close to the way humans think,
- Its application does not require a mathematical model,
- Because the software is simple, it is inexpensive to implement.
Disadvantages of Fuzzy Theory
- Creating the rules used in the application depends on the fuzzy expert,
- Membership functions may take a long time to find because they are obtained through trial and error,
- Stability analysis is difficult to perform (though simulation is possible).
Data Analysis
Data analysis is a statistical technique that aims to explain a measurement with fewer data by bringing together variables that measure the same structure or quality.
For Good Data Analysis;
- There should be variable reduction,
- Independence should be ensured among the newly produced variables or data,
- The results reached (the data obtained) should be meaningful.
Data Analysis Stages and Results
Problem definition and data collection: This is the first stage of preparatory work required for data analysis. In this stage, the purpose of the analysis and the variables to be used are developed in light of theory, existing research, and the researcher’s knowledge and experience or preliminary studies; they are measured with appropriate instruments, and the data are collected through reasonable methods.
Building the correlation matrix: The second stage is where the analysis process begins, and a correlation matrix is created. A correlation matrix shows the relationships among the variables included in the data analysis.
Building regression equations: In the third stage, the largest values in the correlation matrix were selected and regression equations were built to find the relationships among them.
Deciding on the number of data: In the fourth stage, significant data with values greater than 0.05 from the regression equations are selected, and this process is repeated until it is complete.
In light of these stages, we processed 94 patients belonging to 2 diseases (Asthma and Tuberculosis) and 38 different symptoms needed for diagnosis.
At the end of our statistical work, we saw that the “Wheeze” symptom alone was sufficient for diagnosis. However, when we looked at diagnosis by wheeze alone, we found that 6 of the 94 patients’ diagnoses were incorrect, so we ran regression analysis again. This time, instead of looking only at regression values, we also checked whether our equations were significant and included the results of significant equations that did not exceed 0.05.
In the final stage, we saw that using 3 different symptoms (AST, ALT, and Wheeze) produced more accurate results, and we included those 3 symptoms in our calculations.
Sample Application;
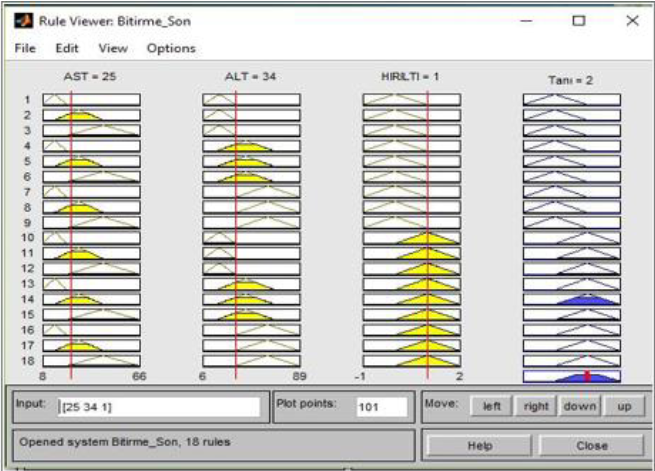
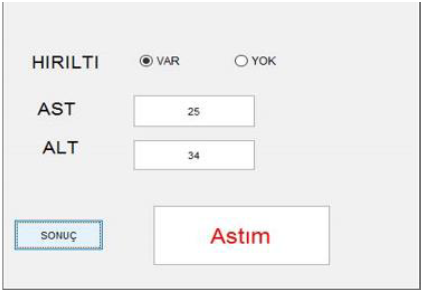
Based on the sample values entered above, the patient was diagnosed with “ Asthma ”.
Important Note: This application was built for educational purposes with sample data and is not suitable for real-world use because not enough sample data was processed.